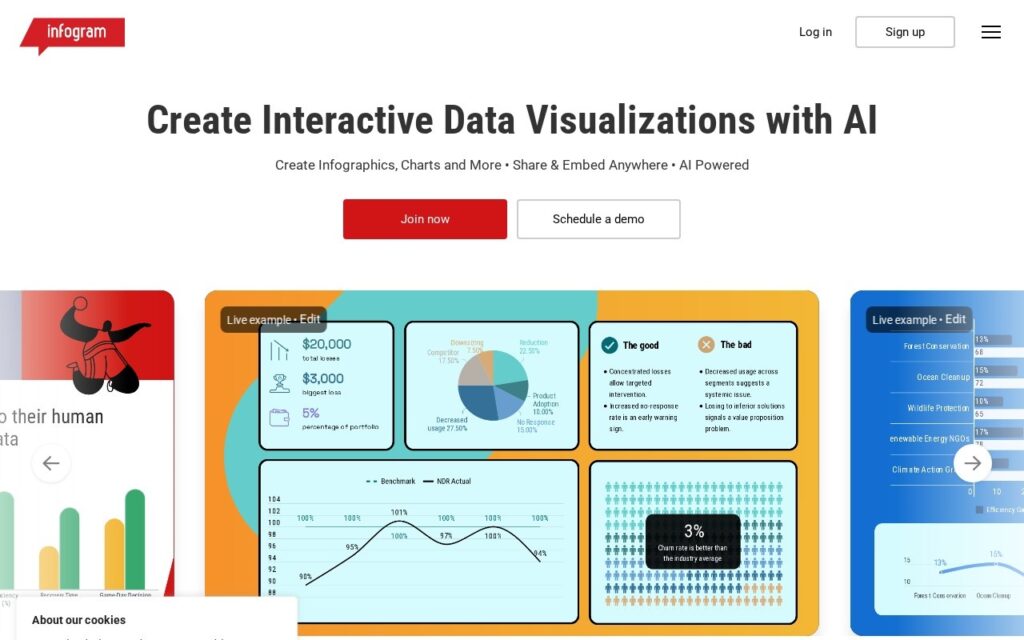
Infogram markets itself around “AI-Powered Everything”: an AI Infographic Maker that generates full infographics automatically, an AI Chart & Graph Generator that builds charts from raw data, AI chart-type recommendations that suggest the optimal visualization for a given dataset, and image-to-data conversion that turns a picture of a chart or table back into structured, editable data.
Image-to-data conversion is the feature worth calling out specifically – it solves the common problem of having data locked inside a screenshot, PDF chart, or someone else’s presentation slide with no easy way to extract and reuse it. Combined with AI chart-type recommendations, the platform is aimed at the actual bottleneck in data visualization: not the drawing itself, but figuring out which chart type correctly represents a given dataset and rebuilding it from source data you may not have in a clean format.
Beyond the AI layer, Infogram offers 35+ customizable chart types, 800+ maps, real-time team collaboration, and SOC 2 Type 2 plus WCAG 2.2 accessibility compliance – relevant for organizations with governance requirements around the tools they adopt. Pricing isn’t shown on the homepage – check the dedicated pricing page.