
Freemium Verified

Bricks

The middle ground between plain Excel and full Tableau complexity

4.2 Data and Analytics
4.2 Very good 4.2

Bottom line: Bricks is a strong data and analytics tool, best known for combined spreadsheet, dashboard, report, and presentation generation. It has a free plan.

Genuinely different middle-ground positioning between simple and complex tools Less powerful than dedicated enterprise BI platforms for complex analysis
Reviewed by Challenging Voice Editorial · Updated Jul 2026 How we rate
PricingFrom $20/mo
Free planYes
CompanyThe Bricks Inc.
PlatformsWeb
Best forData and Analytics
Visits7
Last reviewedJul 2026
UpdatedJul 2026
Ask AI about Bricks ChatGPT Claude Perplexity

Overview

Bricks blends spreadsheet editing, dashboard generation, reporting, and presentation creation into one platform, positioning itself deliberately between tools its own users describe as too basic and tools considered too complex: Excel handles data but not storytelling, Canva handles design but not real data, and Tableau or Power BI can accomplish nearly anything but at a real cost in complexity.

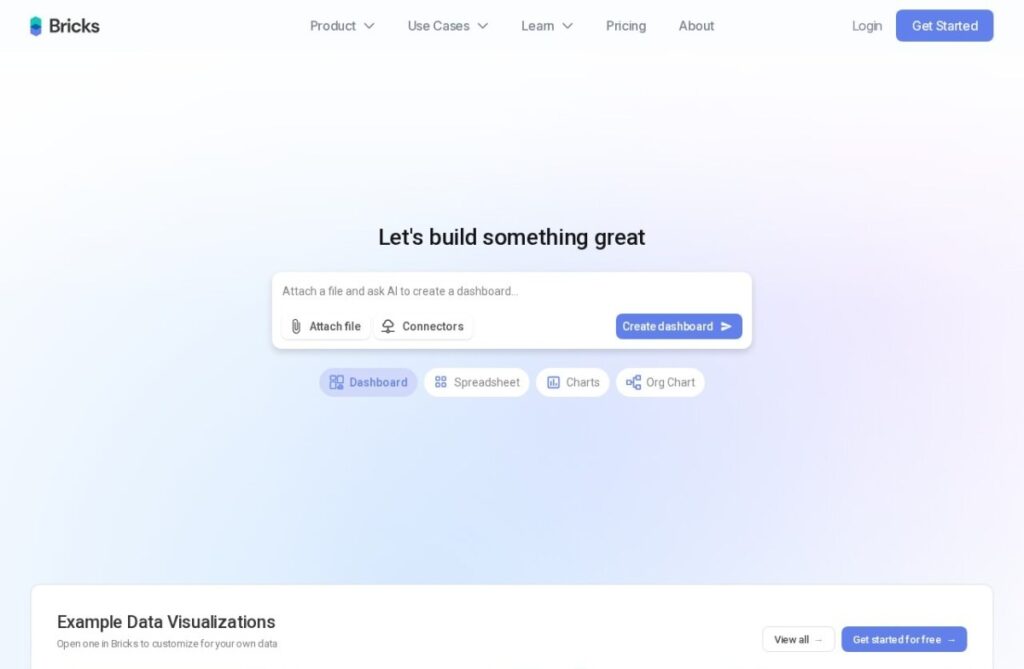
That middle-ground positioning shows in the workflow: upload a CSV, spreadsheet, or database connection, and Bricks generates dashboards, narrative reports, and slide decks from the same underlying data, with drag-and-drop layout adjustment and one-click theme changes rather than rebuilding a visualization from scratch every time the underlying data refreshes.

A free tier covers limited use, and paid plans start around $20 a month for more features and data volume. For someone who wants to turn raw data into a polished report or presentation fast, without Excel's storytelling limits or Tableau's learning curve, Bricks specifically targets the space between the two.

Key features

Screenshots & demo

Bricks screenshot 1

Pricing

Free
Free
  • Core spreadsheet and AI
  • Limited usage
Pro
$20/mo
  • Higher AI limits
  • Advanced generation features

Pros & cons

Pros

  • Genuinely different middle-ground positioning between simple and complex tools
  • Combines several output formats (dashboard, report, deck) from one data source
  • Faster iteration than rebuilding visualizations manually
  • Free tier available to start

Cons

  • Less powerful than dedicated enterprise BI platforms for complex analysis
  • Company founding details are thinner than more established competitors
  • Best suited to teams prioritizing speed and storytelling over deep analytical depth

How it compares

ToolRatingFreeFromBest known for
Bricks (this tool)4.2Yes$20/moCombined spreadsheet, dashboard, report, and presentation generation
Rows4.4Yes$15/moLive API connections directly inside spreadsheet cells
Vanna4.4YesFreeOpen-source RAG framework for text-to-SQL
Databricks Genie4.4NoNatural-language querying grounded in Databricks' lakehouse data

Our verdict

4.2 / 5 4.2

Bricks is a strong data and analytics tool, best known for combined spreadsheet, dashboard, report, and presentation generation. It offers a free plan, with paid upgrades from $20/mo.

What makes it different: Bricks stands out for combined spreadsheet, dashboard, report, and presentation generation.

How we score it
Overall 4.2
Value for money 4.7
Feature depth 4.9
Popularity 3.7
Best for ProfessionalsTeamsCreatorsCurious learners

Frequently asked questions

What is Bricks?
Bricks is a data and analytics tool listed in the Challenging Voice directory. The middle ground between plain Excel and full Tableau complexity.
Is Bricks free?
Yes, Bricks offers a free plan. Paid plans unlock more features and higher usage limits, starting at $20/month.
How much does Bricks cost?
Bricks starts at $20 per month. See the pricing plans above for full details.
What are the best Bricks alternatives?
Popular alternatives to Bricks include Apollo.io, Basedash, and Einstein Analytics. Browse them all in the Data and Analytics category.
Is Bricks any good?
Bricks scores 4.2 out of 5 based on our editorial review.

Reviews

4.2 No reviews yet

Write a review

Similar tools you might like