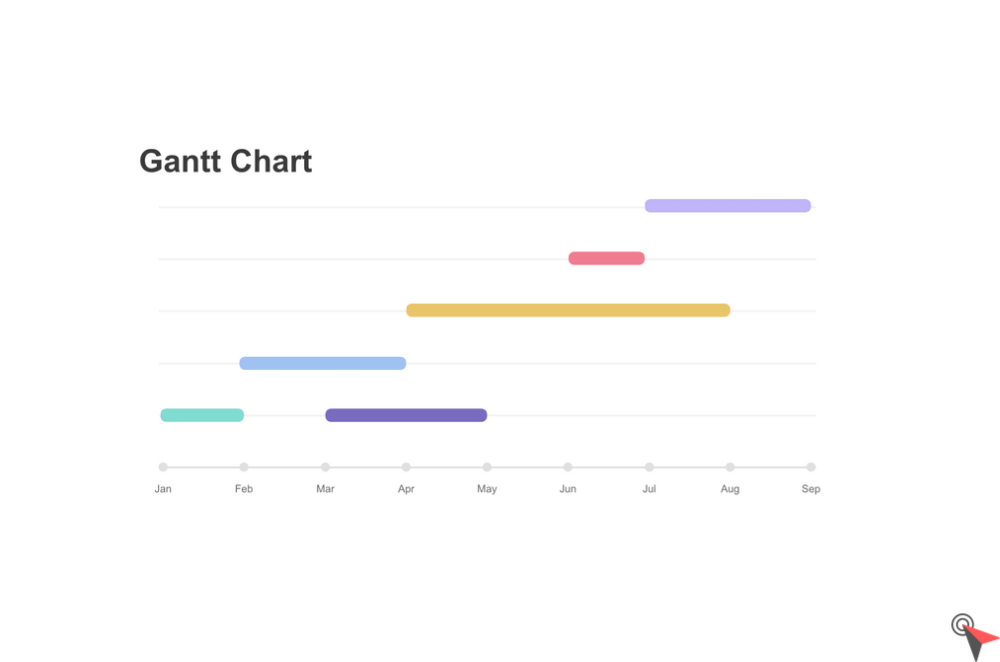
Project managers are used to using a Gantt chart to organize and plan the tasks to be carried out. This tool is not complicated to use and remains very useful, including for small actions.
If you are not familiar with this approach, you will find in this guide the essential points for its use as well as at the very end of the file, a concrete example of a Gantt chart
What is a Gantt chart and what is it used for in project management?
Invented by Henry Gantt in 1910, this tool facilitates planning by representing the tasks of a project by horizontal bars on a graph.
For what use? It is very simple. As we saw in the introduction, it facilitates the organization, planning and monitoring of tasks.
More specifically, it allows to:
- master the sequencing of tasks, especially when certain activities are carried out in parallel
- know the deadline for each key step
- Set milestones to validate the steps
- allocate and manage resources (human, budgetary, material, etc.)
- visualize the tasks to be carried out
- follow the progress of the project and manage it with regard to the planned deadlines in a global or individual way
- estimate the impact of a delay on the end date and other tasks
This approach delivers its full potential for complex projects made up of countless overlapping tasks. However, it remains just as interesting to use for simpler projects.
How to build the diagram?
Prepare your data in a table using Excel or by entering them directly into a dedicated software.
Here are the steps to follow:
- Define project tasks and milestones
Start with big steps by breaking them down into small tasks. The difficulty is finding the right scale. Neither too precise nor too broad. Choose the milestones: according to the deliverables at the end of the stage and the events validating the continuation or the stopping of the project. See the WBS project breakdown method (or task flowchart), to make this work even more rigorous. Organize them in chronological order. - Estimate task duration
The time foreseen for each intervention is an important data for the planning. Choose the most relevant unit: hour, day, week… depending on the project and keep the same reference for the whole table. - Identify the interactions between each activity
Some tasks can only be carried out after another has finished or started (known as “sequential tasks”). In addition, others are treatable in parallel. It is therefore necessary to identify the dependencies. This is the scheduling phase.
4 types of addiction:- Finish to finish (FF): the 2 tasks must be completed at the same time
- Finish-to-start (FD): a task can only start when the previous one is finished. This is the standard chaining mode.
- Start-to-finish (DF): A task cannot be completed until the previous one has started.
- Start to start (DD): a task can only start if the previous one has started
- Assign resources
Define the human and material resources assigned to each task. This data is useful when precise tracking of resource allocation is required. Or simply to find out who does what.
Example of a Gantt chart
To illustrate the method, here is the planning of the different steps to create a website. We have deliberately reduced the process and not mentioned the resources, the milestones, the objective being to keep it simple.
Table with tasks, their duration and dependencies
| Steps | Tasks | Duration (in days) | Dependencies |
| Choose a provider | A – Define the budget | 1.5 | |
| B – Develop the specifications | 8 | A (FD) | |
| C – Pre-select service providers | 2 | B (FD) | |
| D – Consult the candidates | 15 | C (FD) | |
| E – Stop the choice of service provider | 2 | D (FD) | |
| Develop the site | F – Realize the models of the site | 3 | E (FD) |
| G – Expand functions | 10 | F (FD) | |
| H – Carry out the graphical integration | 8 | G (DD) | |
| I – Test and Validate the site | 2 | G, H (FD) | |
| J – Put the site online | 1 | I (FD) | |
| Produce content | K – Define who writes what | 1 | J (FD) |
| L – Create content | 3 | K (FD) | |
| M – Validate and enter the content on the site | 2 | L, I (FD) | |
| Launch the site internally | N – Present the site internally | 2 | J (FD) |
The activity “Enter the content of the site” depends on 2 tasks (type FD). Indeed, the entry can only be done when the site is validated and the content is written. The step “Carry out the graphical integration”, for its part, begins at the same time as “Develop the functions”. Obviously, integrators need to coordinate with developers. This is a DD type dependency.
The Resource Chart
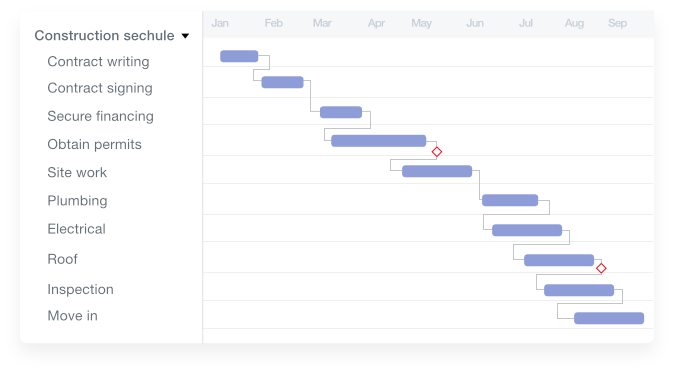
The bars in red represent the critical path. These are the key stages for which a slippage has the effect of delaying the project.
Software to create your Gantt chart
Forget the paper! Today’s tools greatly facilitate the work!
You will find help on the internet for using Excel. It’s not the easiest solution, but if you’re a fan of the Office suite, you’ll find what you’re looking for.
There are dedicated applications (often free), more accessible, such as Gantter for google drive, which allow you to create your schedule very quickly.
Complete online solutions, more advanced, integrate the creation of a Gantt chart among other functionalities dedicated to collaborative work. Smartsheet for example. Locally, on your computer, you can turn to free software like ChallengingVoice.
This software is very practical, even essential, for defining the dependencies between tasks, carrying out simulations, measuring the impacts of a delay, etc. and this, in a few clicks.