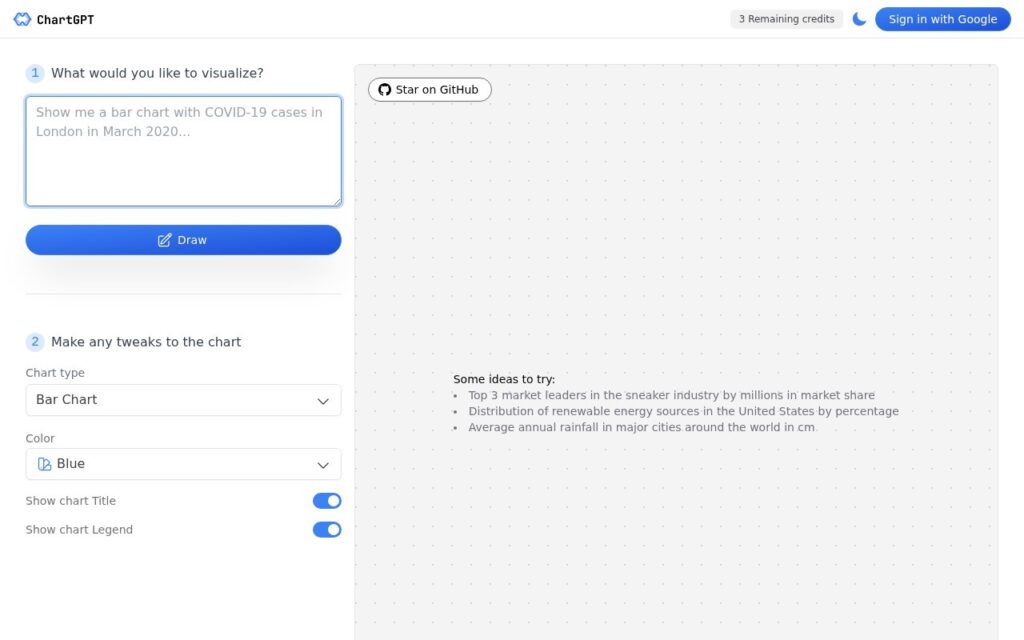
Describe the chart you want in plain English, get it back instantly – customize type, colors, titles, and legends, no charting library or syntax to learn.
ChartGPT is a visualization tool converting natural language descriptions directly into charts. Describe the data you want to visualize, and the platform generates the corresponding chart automatically, using generative AI to interpret descriptive text into a working visualization.
Chart customization covers type selection, color adjustments, and toggle controls for titles and legends, with pre-configured example prompts to guide new users through the workflow. The interface is deliberately simple – describe the visualization need, then refine the output in a second step.
ChartGPT targets anyone needing quick data visualization without technical charting expertise, from business analysts to educators. Sign-in is available via Google, and the project maintains a public GitHub repository; specific pricing isn’t disclosed on the page reviewed.
Key features
Natural language description to chart generation
Customizable chart type, colors, titles, and legends
Pre-configured example prompts for guidance
Simple two-step describe-then-refine workflow
Public GitHub repository
Screenshots & demo
Pricing
ChartGPT offers a free plan, with paid upgrades for higher limits and more features.
Pricing is provided as a guide. Check the official site for the latest plans.
Is ChartGPT expensive?
ChartGPT has no advertised paid tier. Among the 60 priced tools we list in Data and Analytics, the median entry price is $26 a month.
38% of Data and Analytics tools in the directory offer a free tier, and this is one of them.
Compared against every priced listing in Data and Analytics, recalculated as the catalogue changes. Method and the full market breakdown are in our AI tool pricing study.
Pros & cons
Pros
Removes the need to learn a charting library or syntax
Open development via a public GitHub repo adds transparency
Fast, minimal-step workflow from description to visual
Cons
Specific pricing and underlying model aren't disclosed
Best suited to straightforward charts rather than highly customized dashboards
Chart accuracy depends on how clearly the data is described
ChartGPT is a solid data and analytics tool, best known for natural language description to chart generation. It offers a free plan.
What makes it different: ChartGPT stands out for natural language description to chart generation.
How we score it
Overall3.0
Value for money4.7
Feature depth4.9
Popularity3.7
Best forProfessionalsTeamsCreatorsCurious learners
Frequently asked questions
What is ChartGPT?
ChartGPT is a data and analytics tool listed in the Challenging Voice directory. Describe the chart you want in plain English, get it back instantly – customize type, colors, titles, and legends, no charting library or syntax to learn.
Is ChartGPT free?
Yes, ChartGPT offers a free plan. Paid plans unlock more features and higher usage limits.
What are the best ChartGPT alternatives?
Popular alternatives to ChartGPT include SuperAnnotate, S5 Stratos, and Monterey AI. Browse them all in the Data and Analytics category.
Is ChartGPT any good?
ChartGPT scores 3.0 out of 5 based on our editorial review.
Unsupervised AI learns your wind or solar asset's normal behavior, then flags underperformance and detects failures – bearing imbalance, gearbox issues – before they cause downtime.
Agentic AI automates enrichment, transformation, and governance across your entire asset library – search by image, face, text-in-image, or even spoken words.