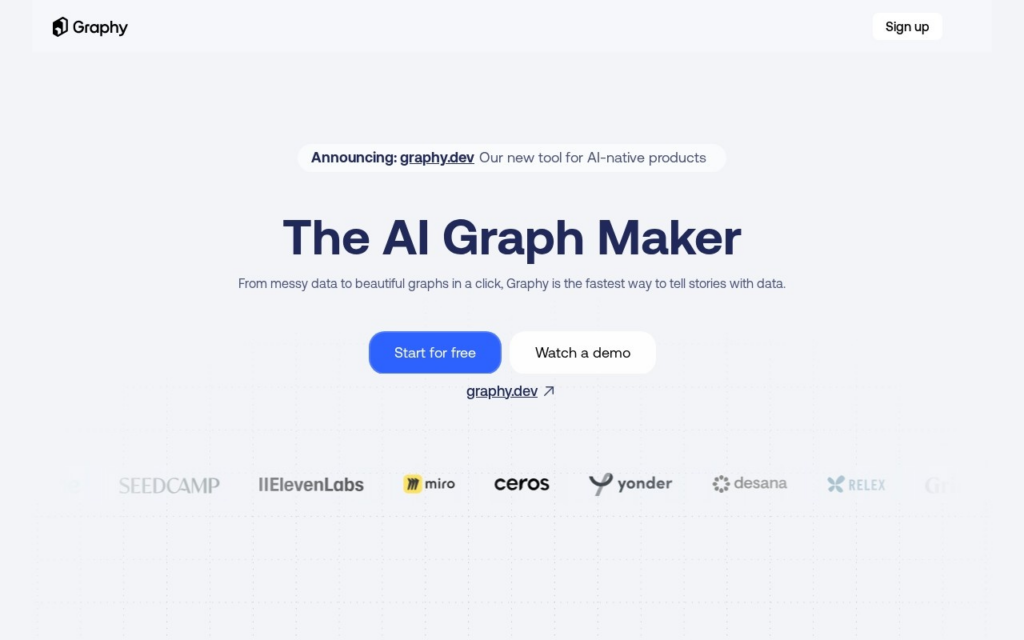
Graphy is an AI-assisted graph and chart-making platform established in 2019 in London by CEO Andrey Vinitsky and co-founder Roman Sirbu. The company raised $10.5 million in seed funding across two rounds from investors including Northzone and Coatue.
The platform's core idea is removing manual chart-formatting work: users upload or connect data, and the AI analyzes its structure to suggest the visualization type most likely to communicate it clearly, whether a trend line, comparison bars, or a more complex multidimensional view. Finished graphs are interactive and can be embedded or shared outside Graphy itself.
It fits marketers, founders, and analysts who need presentation-ready charts without a dedicated design or BI team, reporting more than 300,000 users and $3 million in revenue in 2024. Graphy has a free starting tier, with paid plans for teams needing more data sources, exports, and collaboration features.
Graphy has no advertised paid tier. Among the 66 priced tools we list in Data and Analytics, the median entry price is $26 a month.
39% of Data and Analytics tools in the directory offer a free tier, and this is one of them.
Compared against every priced listing in Data and Analytics, recalculated as the catalogue changes. Method and the full market breakdown are in our AI tool pricing study.
Describe the chart you want in plain English, get it back instantly – customize type, colors, titles, and legends, no charting library or syntax to learn.
The middle ground between plain Excel and full Tableau complexity
Plotly Studio does agentic data analysis – an LLM builds real Plotly charts and Dash apps, backs every step with visible code, and asks when something's ambiguous.
Agentic AI turns your data into working Excel files with formulas, live dashboards, and finished presentations – not suggestions, actual deliverables ready to use.