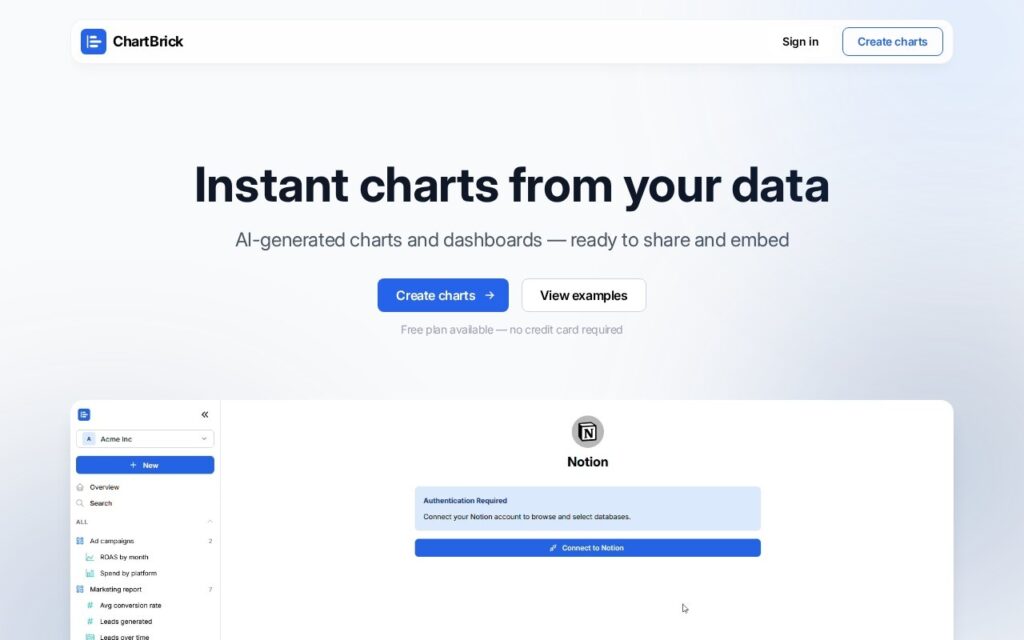
ChartBrick centers its entire value proposition on AI chart generation: connect a data source and AI automatically picks the best chart type for that data, eliminating the manual chart-selection step most visualization tools leave entirely to the user’s own judgment.
Automatic chart-type selection is a genuinely useful capability for people who aren’t data-visualization specialists – choosing the right chart type for a given dataset (when to use a bar chart versus a heatmap versus a waterfall chart, for instance) is a real skill most people outside data roles haven’t developed, and getting that recommendation automatically means the resulting visualization is more likely to actually communicate the data clearly rather than being a technically-correct-but-confusing default choice.
ChartBrick supports 20-plus chart types and connects to Notion, Airtable, Google Sheets, Stackby, PostgreSQL, MySQL, Excel, CSV, JSON, and REST APIs, with auto-updating charts that reflect live data changes, shareable links, embed codes, and data encryption/privacy protections. A free plan is available with no credit card required; paid tier details require visiting the pricing section.