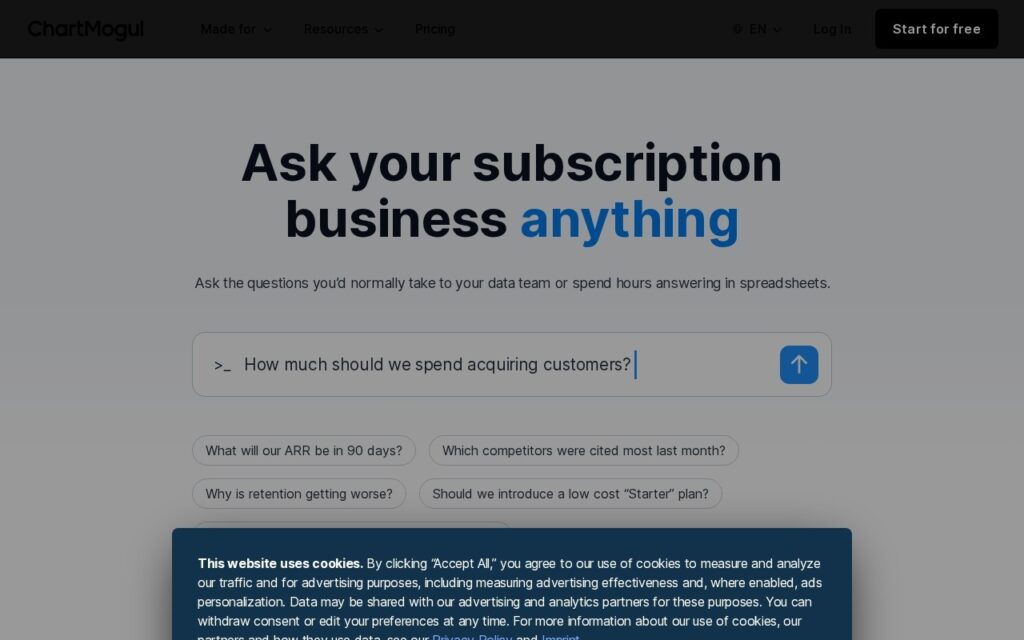
ChartMogul is subscription analytics for recurring revenue businesses, now built around asking questions in plain language rather than assembling dashboards – “what will our ARR be in 90 days”, “why is retention getting worse”, “should we introduce a low-cost starter plan”.
The reframing addresses the real bottleneck in revenue analytics, which was never the data. Subscription metrics have been well understood for a decade; the constraint is that answering a non-standard question means someone builds a query, and so the questions that get asked are the ones already on a dashboard. Removing that step changes which questions get asked at all – and forward-looking ones like a 90-day ARR projection are exactly the sort nobody builds a report for.
It is free to start. The judgement to apply is about the answers rather than the interface: a plain-language layer will answer confidently whether or not the underlying data supports it, so check how it handles a question your data genuinely cannot answer. Projections in particular are extrapolations, not forecasts with error bars.
Key features
Plain-language querying of subscription data
Standard subscription metrics – ARR, MRR, churn, retention
Forward-looking revenue projections
Competitor and market context questions
Integrations with billing and payment systems
Free tier to start
Screenshots & demo
Pricing
ChartMogul offers a free plan, with paid upgrades for higher limits and more features.
Pricing is provided as a guide. Check the official site for the latest plans.
Is ChartMogul expensive?
ChartMogul has no advertised paid tier. Among the 66 priced tools we list in Data and Analytics, the median entry price is $26 a month.
39% of Data and Analytics tools in the directory offer a free tier, and this is one of them.
Compared against every priced listing in Data and Analytics, recalculated as the catalogue changes. Method and the full market breakdown are in our AI tool pricing study.
Pros & cons
Pros
Removes the build-a-report step that limits which questions get asked
Answers forward-looking questions nobody builds dashboards for
Free entry point with established subscription metrics underneath
Cons
A plain-language layer answers confidently whether or not the data supports it
Projections are extrapolations, not forecasts with error bars
Query data from any source, structured or not, in plain language – String takes initiative on what's worth surfacing rather than just answering the literal question you asked.
ChartMogul is subscription analytics for recurring revenue businesses, now built around asking questions in plain language rather than assembling dashboards – "what will our ARR be in 90 days", "why is retention getting worse", "should we introduce a low-cost starter plan".
Is ChartMogul free?
Yes, ChartMogul offers a free plan. Paid plans unlock more features and higher usage limits.
What are the best ChartMogul alternatives?
The closest matches in the directory are Livedocs, Fluent, and Airbook, compared side by side above.
Ask your database a question in plain English instead of writing SQL – GPT-3-powered, connects to Postgres, MySQL, and MariaDB, with connection strings hashed and no data stored.
"Deterministic AI" grounded in your structured data – reliable, hallucination-free answers, plus 24/7 anomaly detection that alerts you before problems hit.