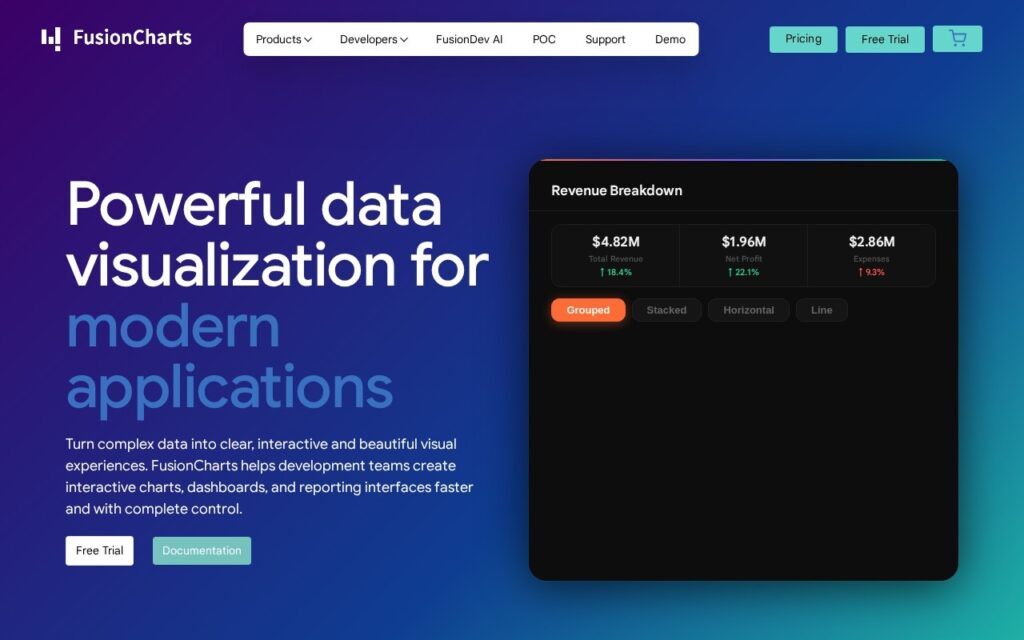
FusionCharts is a commercial JavaScript charting library for building interactive charts, dashboards and reporting interfaces in web and mobile applications. The site advertises more than 100 chart types and support for React, Angular, Vue and other frameworks, and the product family includes separate Time, Grid and Maps components. It is made by FusionCharts, Inc., part of the Idera group.
The AI feature is Ask FusionDev AI, an assistant the site says is powered by advanced language models and trained on FusionCharts’ documentation and best practices. Developers ask about chart creation, customization and data integration, and it answers from the documentation and suggests code. The page does not name the underlying model, does not say whether the assistant is free or needs a login, and carries its own warning that AI-generated content may contain inaccuracies and should be checked against the official documentation. On the pages reviewed it is a developer-support add-on to a charting library, and the charts themselves are not described as AI-generated.
Licences are per developer and are sold as annual subscriptions or perpetual licences. The cart page lists a free trial for a single developer, Pro at $1,899 a year ($4,799 perpetual) for five developers and internal apps, Enterprise at $3,399 a year ($8,399 perpetual) for ten developers with SaaS and on-premise deployment, and a custom Enterprise+ tier that includes source code; the FusionGrid component is $499 a year. The starting price shown here is the monthly equivalent of Pro. The pricing page does not mention Ask FusionDev AI, so how the assistant is priced is unstated, and third-party listings show different figures, so confirm the current price at checkout.