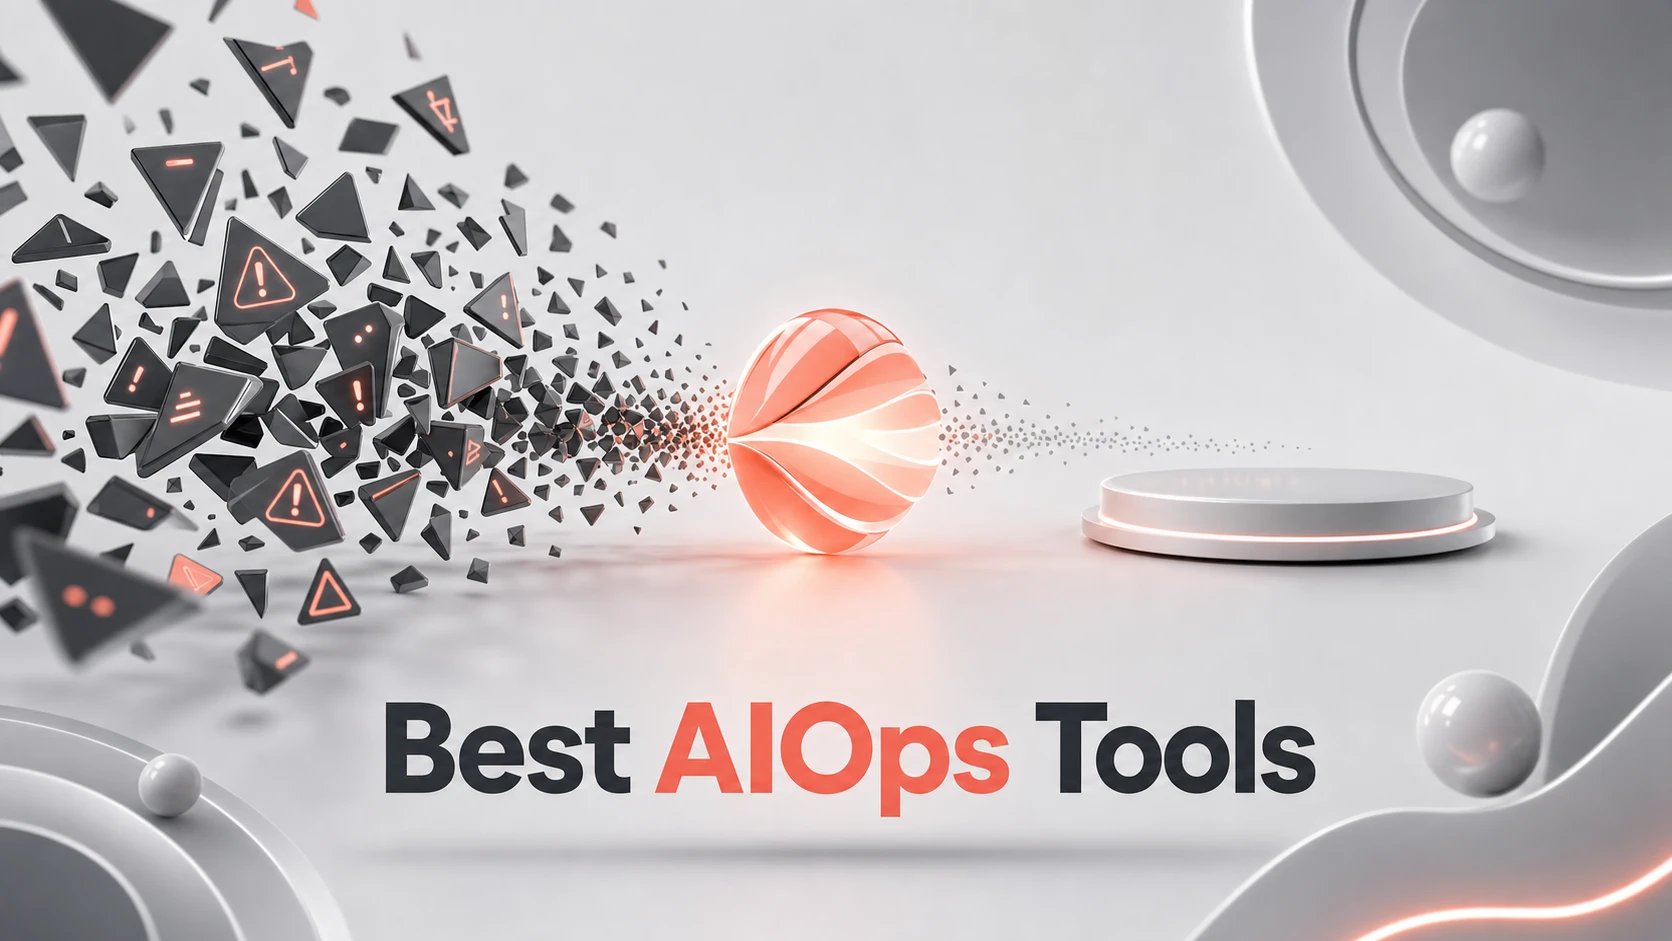
If alert storms and slow root-cause analysis are eating your on-call hours, the right AIOps tool can cut the noise fast. AIOps, short for AI for IT operations, uses machine learning to correlate alerts, find root causes, and route incidents so your team stops drowning in dashboards. The eight best AIOps tools in 2026 are OpenObserve, Dynatrace, Datadog, New Relic, Splunk Observability Cloud, Grafana Cloud, BigPanda, and LogicMonitor, each strongest for a different job. Below, you get what each one is, where it wins, and the tradeoff nobody markets, so you can shortlist two or three fast.
Criteria for Picking the Best AIOps Tools
This is a curated shortlist built for evaluation, not a hands-on benchmark. We ranked each tool on how consistently it showed up across current AIOps roundups for the jobs that actually decide a purchase: cutting alert noise, finding root cause, and fitting real incident workflows.

Here is the exact lens we used, so you can see why these eight made the cut:
- Correlation strength and how well it groups related alerts
- Root-cause quality, including causal and topology-aware analysis
- Automation depth for triage, routing, and remediation
- Observability coverage across logs, metrics, and traces
- ITSM and incident workflow integration
- Deployment flexibility for cloud, hybrid, and self-hosted setups
- Pricing transparency and predictability
Pricing is a real buying signal, but it is not the only one. A tool with a lower list price still loses if it cannot fit your deployment model or reduce the alert fatigue that started the search. Most buyers begin with noise reduction and only later realize the harder filter is workflow fit and data coverage.
Best AIOps Tools at a Glance
Here is the 30-second shortlist before the detailed reviews. Some prices below are quote-based or range-based, so treat the pricing column as directional, not a quote.
| Tool | Best For | Starting Price |
|---|---|---|
| OpenObserve | Cost-conscious, compliance-heavy platform teams | Ingestion-based, roughly $0.10 to $0.30/GB |
| Dynatrace | Large enterprises needing causal RCA | Host or event-based, $50K to $500K+/year |
| Datadog | Cloud-native teams wanting broad coverage | Usage-based, $10K to $100K+/month |
| New Relic | Developer teams tying AIOps to code | Usage-based per GB, 100GB/month free |
| Splunk Observability Cloud | SecOps and compliance-heavy enterprises | Data-volume based |
| Grafana Cloud | Open-source, dashboard-first teams | Per-host plus add-ons, $10K to $50K/month |
| BigPanda | Enterprises with alert storms and tool sprawl | Per-node, $20K to $100K/year |
| LogicMonitor | Hybrid IT teams and managed service providers | Per-device |
The fastest shortlist decisions usually come from matching your team type to a pricing model and deployment style, not from chasing the longest feature list.
Best AIOps Tools for Observability-First Teams
These four tools win when observability, root-cause analysis, and AI-assisted troubleshooting are your main buying triggers. The real split here is between full-fidelity telemetry platforms that collect everything and tools that layer intelligence on top of an existing stack. Watch for the difference between transparent reasoning, deterministic causal analysis, and code-level remediation, because that is what separates them in practice.

1. OpenObserve
OpenObserve Is an AI-native observability platform built around full-fidelity telemetry, made for platform teams that refuse to pay a heavy premium for AI features. It ingests logs, metrics, and traces into one stack, then layers a three-part AI setup on top for guided troubleshooting. What makes it stand out is transparency: it aims to show its reasoning instead of hiding it behind a black box. The honest catch is community maturity, because its AI agent ecosystem is newer than what the legacy vendors have built over a decade.
- Best for: Cost-conscious, compliance-heavy platform teams running both traditional infrastructure and AI workloads
- Standout feature: A three-layer AI stack combining MCP integration, an AI assistant, and an SRE agent
- Starting price: Ingestion-based, roughly $0.10 to $0.30/GB with predictable scaling
2. Dynatrace
Dynatrace Is a premium full-stack AIOps platform for large enterprises where downtime costs enough to justify the price. Its Davis AI engine runs deterministic causal analysis, so instead of guessing which alert matters, your team moves from symptom to likely root cause faster. That causal rigor is the reason it keeps showing up in enterprise shortlists. The tradeoff is blunt: it is the most expensive option here, configuration is complex, and its coverage for newer LLM observability needs is limited.
- Best for: Large enterprises with complex hybrid environments and mature operations teams
- Standout feature: The Davis AI engine with deterministic causal analysis
- Starting price: Host or event-based premium, typically $50K to $500K+/year
3. Datadog
Datadog Is the wide-coverage option for cloud-native teams that want infrastructure, applications, logs, and security in one console. Its Bits AI conversational troubleshooting speeds up live incident investigation, and its integration count is one of the broadest on the market. If your stack already lives in Datadog, adding its AIOps layer is the path of least resistance. The recurring warning is cost: usage-based billing can produce bill shock, and heavy data volumes push teams toward sampling, which quietly thins the data you actually rely on.
- Best for: Cloud-native enterprises already invested in the Datadog ecosystem
- Standout feature: Bits AI conversational troubleshooting plus 700+ integrations
- Starting price: Usage-based, typically $10K to $100K+/month
4. New Relic
New Relic Is a developer-centric observability platform that ties AIOps directly to application behavior. It ingests metrics, events, logs, and traces into one store and adds AI for query help and code-level remediation, so you can trace a performance issue back to the code that caused it. That code connection is where it beats broader observability-first tools. And it has a genuine free tier, with 100GB per month included on every account. The catch is that costs rise with data volume, and newcomers often find the feature set overwhelming at first.
- Best for: Product engineering teams that want AIOps tied to code and incident response
- Standout feature: Code-level remediation and an AI-powered query assistant
- Starting price: Usage-based per GB across Standard, Pro, and Enterprise tiers
- Free tier: 100GB per month free on every account
Best AIOps Tools for Correlation and Hybrid Operations
These four tools shine when you already have monitoring data and the real job is correlation, routing, hybrid visibility, or bridging your existing stack. Two of them are broad platforms, and two are specialists, so read the split carefully. A correlation specialist like BigPanda does one thing well but depends on the quality of the data upstream, while a monitoring platform like LogicMonitor collects the telemetry itself.

5. Splunk Observability Cloud
Splunk Observability Cloud Brings security and operations closer together, which is its whole reason to exist. It is strongest when compliance, investigation depth, and broad log search all matter in the same incident. Its AI assistant and SecOps crossover let teams investigate a failure and a security event in one workflow instead of two. The tradeoffs are well documented: storage gets expensive at scale, searches can run slower, and its query language, SPL, adds a learning curve for anyone new to the ecosystem.
- Best for: SecOps and compliance-heavy enterprises already using Splunk
- Standout feature: The Splunk AI Assistant and SecOps convergence
- Starting price: Data-volume based, generally at the higher end
6. Grafana Cloud
Grafana Cloud Is the visualization-first choice for teams committed to open-source tooling. It layers AI-assisted insights onto the Grafana dashboards your team already knows, so you gain intelligence without abandoning familiar workflows. Its SRE Agent and Anthropic Claude integration sit on top of the open stack of Prometheus, Loki, and Tempo. Be realistic about the catch, though: native AI features are still limited compared with the dedicated platforms, and per-host pricing with add-ons can get complicated to forecast.
- Best for: Teams committed to open-source monitoring stacks
- Standout feature: An SRE Agent plus Anthropic Claude integration on the Grafana stack
- Starting price: Per-host plus add-ons, typically $10K to $50K/month
7. BigPanda
BigPanda Is an event intelligence platform built for one job: cutting alert noise in crowded operations environments. It pulls alerts from your existing monitoring and groups related signals into incidents, so it fits teams that want correlation without ripping out current investments. Its Open Box Machine Learning is the differentiator, because it shows you how correlation decisions get made instead of hiding them. The honest limitation is that it adds another tool to your stack and leans heavily on accurate upstream data and service mappings to work well. If you want a strong upstream layer here, our roundup of the Best AI workflow automation tools Pairs neatly with correlation platforms like this one.
- Best for: Enterprises with tool sprawl and large alert volumes
- Standout feature: Open Box Machine Learning with transparent correlation logic
- Starting price: Per-node, typically $20K to $100K/year
8. LogicMonitor
LogicMonitor Is a hybrid infrastructure monitoring platform for teams whose real challenge is getting one view across cloud and on-prem. Its agentless discovery and thousands of out-of-the-box plugins make it faster to scale across mixed environments and diverse client setups. That breadth is why managed service providers reach for it. The tradeoff is depth: it is less cloud-native than some rivals, stronger on infrastructure coverage than application-level tracing, and its interface has known rough edges. The high volume of data it collects also means you should expect to tune alert thresholds early to avoid false positives.
- Best for: Hybrid IT teams and managed service providers
- Standout feature: Agentless monitoring with broad hybrid infrastructure coverage
- Starting price: Per-device pricing
Comparison Summary and Shortlist Advice
Use this table for fast orientation, then read the scenario shortcuts under it to narrow your finalists.

| Tool | Best For | Starting Price |
|---|---|---|
| OpenObserve | Transparency and self-hosting on a budget | Ingestion-based, $0.10 to $0.30/GB |
| Dynatrace | Causal RCA at enterprise scale | $50K to $500K+/year |
| Datadog | Broad cloud ecosystem coverage | $10K to $100K+/month |
| New Relic | Code-level observability | Per GB, 100GB/month free |
| Splunk Observability Cloud | Security plus observability | Data-volume based |
| Grafana Cloud | Open-source dashboards | $10K to $50K/month |
| BigPanda | Alert noise reduction | $20K to $100K/year |
| LogicMonitor | Hybrid infrastructure | Per-device |
Quick scenario shortcuts to speed up the decision:
- Best for transparency and self-hosting: OpenObserve
- Best for causal RCA at enterprise scale: Dynatrace
- Best for broad cloud ecosystem coverage: Datadog
- Best for code-level observability: New Relic
- Best for correlation and alert noise reduction: BigPanda
- Best for hybrid infrastructure: LogicMonitor
How we picked: we weighted correlation strength, root-cause quality, automation depth, observability coverage, ITSM fit, deployment flexibility, and pricing transparency, and favored tools that appeared repeatedly across current AIOps roundups for those jobs. This is a research-based shortlist, not a lab test, so treat it as your starting point. Buyers rarely compare eight tools to pick one winner; they compare eight to narrow to two or three finalists. If security operations weigh heavily in your incident process, our guide to the Top AI tools for cybersecurity Is worth reading alongside this list.
AIOps Buying Questions Answered
Which AIOps tool is best for a small startup, a lone developer, or a big enterprise?
New Relic fits a lone developer or small startup best, because its 100GB free tier lets you run real workloads before paying. A mid-market team drowning in alerts should look at BigPanda for correlation. A large enterprise with complex hybrid systems and a real downtime cost gets the most from Dynatrace and its causal analysis.
How is AIOps different from observability?
Observability is the data layer that collects logs, metrics, and traces so you can see what your systems are doing. AIOps is the intelligence layer that applies machine learning to that data to correlate alerts, find root cause, and route incidents. You need observability first, then AIOps decides what actually matters.
Can AIOps help reduce alert fatigue?
Yes, and it is the single most common reason teams adopt it. AIOps tools group related alerts into a small number of incidents instead of flooding on-call with hundreds of separate notifications. Correlation specialists like BigPanda are built almost entirely around this, using machine learning to compress noise so your team responds to signal, not spam.
What should you test in an AIOps proof of concept?
Test whether the platform can answer “why did this happen,” not just “something happened.” Run your own real alerts and telemetry through it, check how much alert noise it actually removes, and confirm it fits your incident workflow and ITSM tools. Evaluate governance too: role-based access, auditability, and how it handles your data in a live environment rather than a scripted demo.
Do AIOps tools support self-hosting or hybrid deployment?
Some do, and it matters for compliance-heavy teams. OpenObserve is built around self-hosting and predictable ingestion economics, while LogicMonitor is designed for hybrid environments that mix on-prem and cloud. The premium SaaS platforms lean cloud-first, so if data residency or self-hosting is a hard requirement, filter for it before you shortlist.
Picking Your Two or Three Finalists
AIOps buying decisions succeed or fail on fit, not feature count. Match the tool to the job you actually have: transparency and cost control point to OpenObserve, causal root-cause depth points to Dynatrace, and pure alert-noise pain points to BigPanda. Weigh each finalist against your real stack, budget, deployment model, and how mature your operations team is today. Shortlist two or three of these best AIOps tools, then run a proof of concept against your own alerts, telemetry, and workflows before you sign anything. For more on the automation layer that turns AIOps detection into action, see our breakdown of the Top robotic process automation tools powered by AI.