AI-powered data visualization uses machine learning to turn raw data into charts and dashboards automatically — suggesting the right chart type, surfacing patterns a human might miss, and generating plain-language summaries of what the data actually shows. This guide covers how the process works, best practices for using it well, and the 15 platforms worth knowing.
How AI-Powered Data Visualization Works
The pipeline runs from raw data to insight: ingesting data from wherever it lives, cleaning and preparing it (still the step that eats the most time in practice), engineering the features a model will use, generating the visualization itself, then generating the actual insight — the plain-language read on what the chart is showing, which is what separates these tools from traditional BI software. The real value shows up in automated insights that surface patterns without a manual query, faster data exploration, and dashboards accessible enough that non-analysts can self-serve instead of filing a ticket with the data team.
Best Practices
Start with a clear objective rather than exploring data for its own sake — AI tools make it easy to generate dozens of charts, only a few of which actually answer a real question. Data quality still matters more than the sophistication of the model on top of it; garbage in produces confident-looking garbage out. Design for the actual audience using the dashboard, not for the analyst who built it. And treat ethical considerations (what the data represents, who it’s about, how it could mislead if read out of context) and continuous improvement as ongoing practices, not a one-time setup step.
Top Tools of AI Data Visualization
Tableau
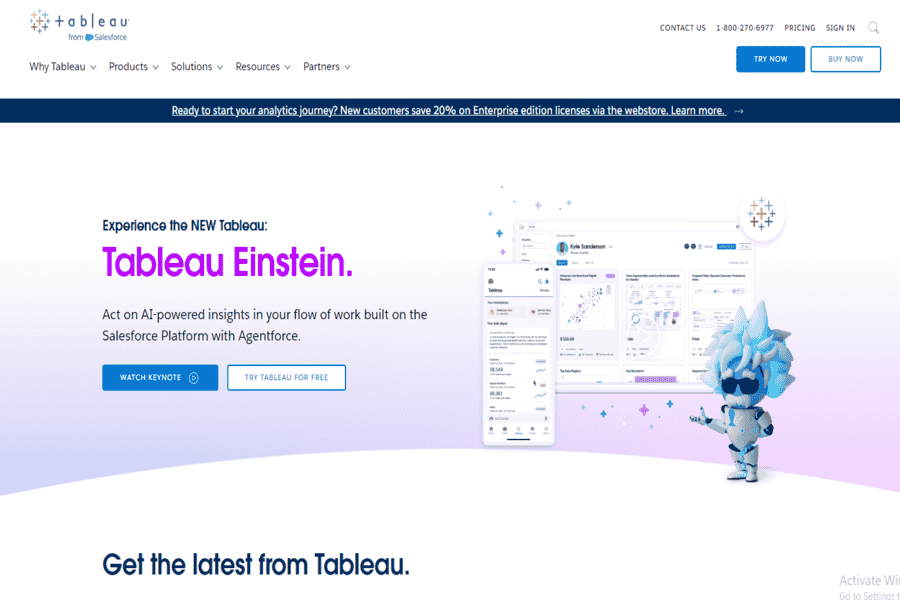
Tableau is a leading data visualization platform with AI features for predictive analytics and natural language processing (NLP). It allows users to create dynamic dashboards and gain insights without deep technical expertise.
Key Features:
- AI-powered analytics with Tableau AI.
- Easy integration with various data sources.
- Drag-and-drop functionality for custom dashboards.
Pros:
- User-friendly interface.
- Strong community support and resources.
- Highly customizable visualizations.
Cons:
- High licensing costs for large organizations.
- Requires some training for advanced features.
Pricing:
- Creator Plan: $70/user/month.
- Explorer Plan: $42/user/month.
- Viewer Plan: $15/user/month.
Social Media Links:
- Facebook: facebook.com/tableau
- Instagram: instagram.com/tableau
- LinkedIn: linkedin.com/company/tableau-software
- Twitter: twitter.com/tableau
- YouTube: youtube.com/user/tableausoftware
Contact Information:
- Email: [email protected]
- Contact Number: +1-206-633-3400
Power BI
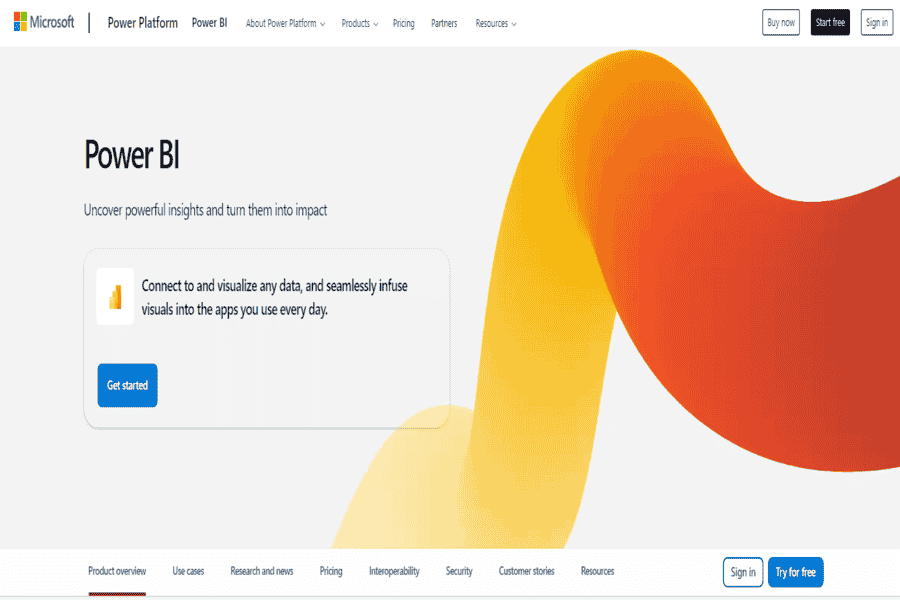
Microsoft Power BI is an AI-driven data visualization tool that integrates seamlessly with Microsoft products. It offers advanced analytics and interactive visualizations for businesses of all sizes. For data-driven insights and strategic guidance, businesses consider Power BI Development Solutions as an excellent option.
Key Features:
- AI insights with Power BI AI.
- Customizable and shareable dashboards.
- Real-time data streaming and updates.
Pros:
- Affordable and scalable.
- Integration with Microsoft ecosystem.
- Extensive library of visualization templates.
Cons:
- Limited customization compared to competitors.
- The steeper learning curve for beginners.
Pricing:
- Pro Plan: $10/user/month.
- Premium Plan: $20/user/month.
Social Media Links:
- Facebook: facebook.com/MicrosoftPowerBI
- Instagram: instagram.com/microsoft
- LinkedIn: linkedin.com/showcase/microsoft-power-bi
- Twitter: twitter.com/MSPowerBI
- YouTube: youtube.com/MicrosoftPowerBI
Contact Information:
- Email: [email protected]
- Contact Number: +1-800-642-7676
Google Looker
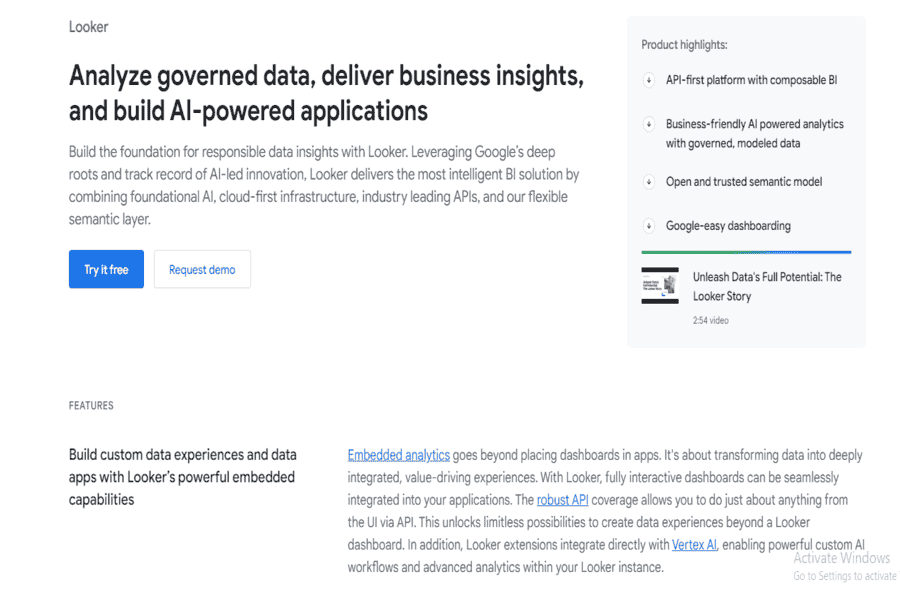
Google Looker is an enterprise-grade BI platform that leverages AI to offer advanced analytics and tailored data visualization solutions. It’s designed for in-depth data exploration.
Key Features:
- AI and machine learning integration with Google Cloud.
- Highly customizable visualization options.
- Collaboration tools for teams.
Pros:
- Scalable for enterprise needs.
- Real-time data integration.
- Advanced data exploration capabilities.
Cons:
- Expensive for small businesses.
- Requires technical expertise for setup.
Pricing:
- Custom pricing based on usage and business size.
Social Media Links:
- Facebook: facebook.com/googlecloud
- Instagram: instagram.com/googlecloud
- LinkedIn: linkedin.com/showcase/google-cloud
- Twitter: twitter.com/googlecloud
- YouTube: youtube.com/GoogleCloud
Contact Information:
- Email: [email protected]
- Contact Number: +1-866-246-6453
Qlik Sense
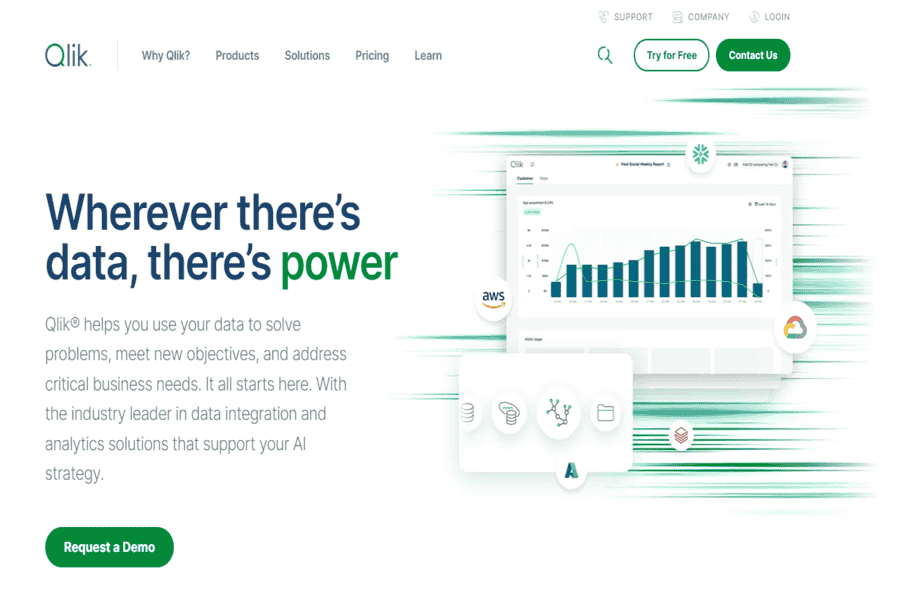
Qlik Sense uses AI and machine learning to provide guided analytics and advanced visualizations. It enables users to discover data patterns and insights with ease.
Key Features:
- AI-powered data association engine.
- Self-service analytics and reporting.
- Interactive dashboards with dynamic updates.
Pros:
- Intuitive drag-and-drop functionality.
- High data security standards.
- Scalability for enterprise-level operations.
Cons:
- Expensive for small teams.
- Complex setup for large-scale data integration.
Pricing:
- Business Plan: $30/user/month.
- Enterprise Plan: Custom pricing.
Social Media Links:
- Facebook: facebook.com/qlik
- Instagram: instagram.com/qlik
- LinkedIn: linkedin.com/company/qlik
- Twitter: twitter.com/qlik
- YouTube: youtube.com/Qlik
Contact Information:
- Email: [email protected]
- Contact Number: +1-866-616-4960
IBM Cognos Analytics
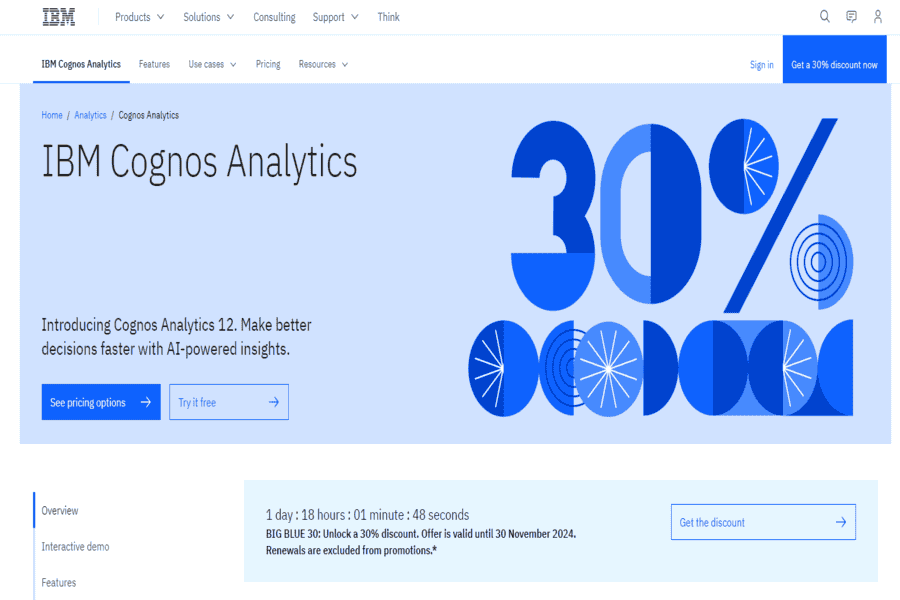
IBM Cognos Analytics combines AI with data visualization to offer automated insights and custom dashboards. It is suitable for businesses looking for in-depth analytics and forecasting.
Key Features:
- AI-driven data storytelling.
- NLP for query-based insights.
- Advanced reporting tools.
Pros:
- Strong support for enterprise needs.
- Integration with IBM Watson for AI capabilities.
- Automated data preparation.
Cons:
- High costs for full features.
- The steeper learning curve for new users.
Pricing:
- Starting at $15/user/month for basic plans.
Social Media Links:
- Facebook: facebook.com/IBM
- Instagram: instagram.com/ibm
- LinkedIn: linkedin.com/company/ibm
- Twitter: twitter.com/IBMAnalytics
- YouTube: youtube.com/IBMAnalytics
Contact Information:
- Email: [email protected]
- Contact Number: +1-877-426-6006
Domo
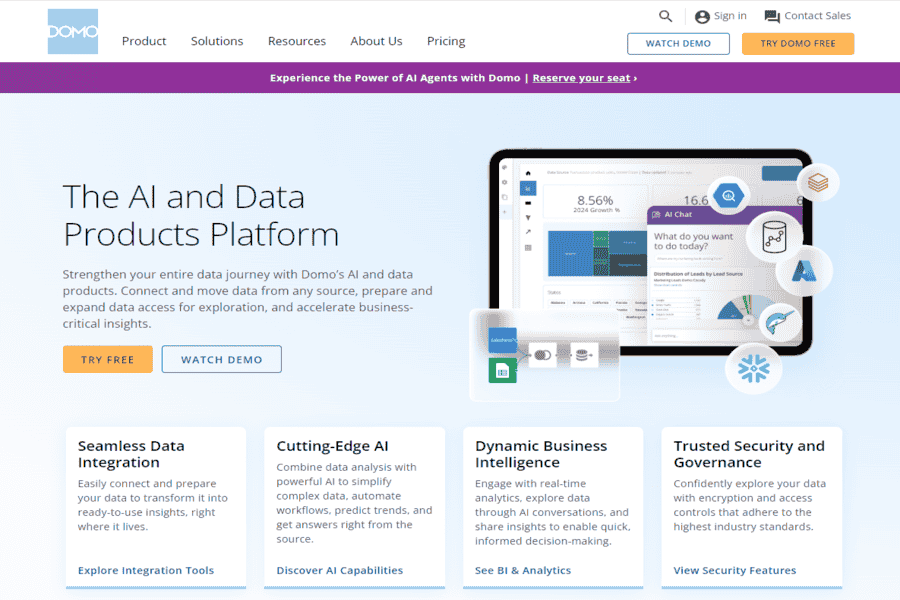
Domo is a cloud-based business intelligence platform that uses AI for advanced data visualization and real-time analytics. It’s designed for collaborative decision-making in organizations.
Key Features:
- AI-driven alerts and recommendations.
- Extensive library of pre-built connectors.
- Real-time data syncing and visualization.
Pros:
- User-friendly interface.
- Collaboration tools for teams.
- Scalable for organizations of all sizes.
Cons:
- Expensive for small businesses.
- Limited offline access.
Pricing:
- Custom pricing based on organizational needs.
Social Media Links:
- Facebook: facebook.com/domo
- Instagram: instagram.com/domo
- LinkedIn: linkedin.com/company/domoinc
- Twitter: twitter.com/domotalk
- YouTube: youtube.com/Domo
Contact Information:
- Email: [email protected]
- Contact Number: +1-801-899-1000
Sisense
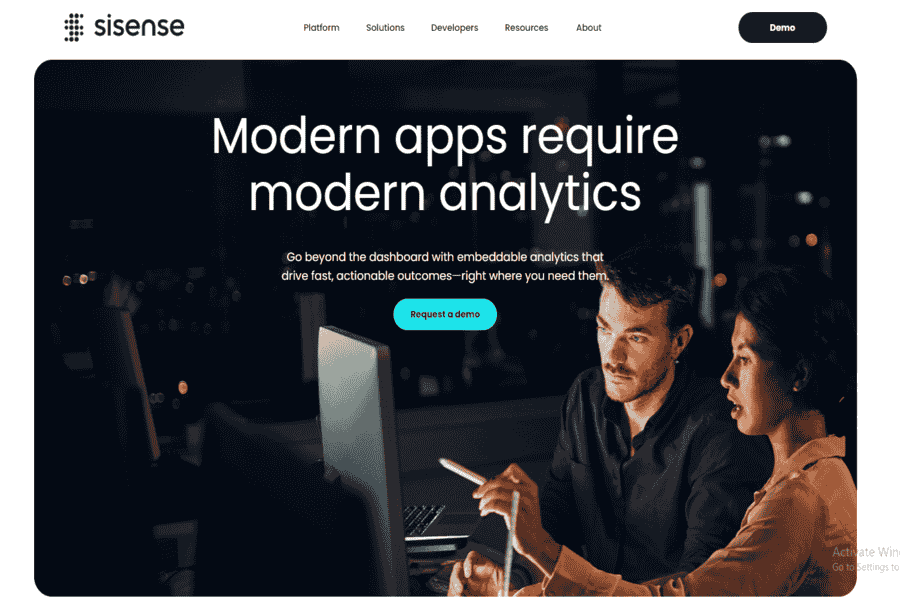
Sisense provides AI-powered analytics and interactive data visualization tools. It is designed to simplify complex data for better decision-making.
Key Features:
- Embedded AI capabilities.
- Customizable dashboards with advanced visualizations.
- Integration with various data sources.
Pros:
- Highly scalable for large enterprises.
- Strong support for embedded analytics.
- Flexible deployment options (cloud, on-premise).
Cons:
- Expensive for small businesses.
- Requires technical expertise for advanced features.
Pricing:
- Custom pricing based on business requirements.
Social Media Links:
- Facebook: facebook.com/sisense
- Instagram: instagram.com/sisense
- LinkedIn: linkedin.com/company/sisense
- Twitter: twitter.com/sisense
- YouTube: youtube.com/Sisense
Contact Information:
- Email: [email protected]
- Contact Number: +1-646-661-2160
Zoho Analytics
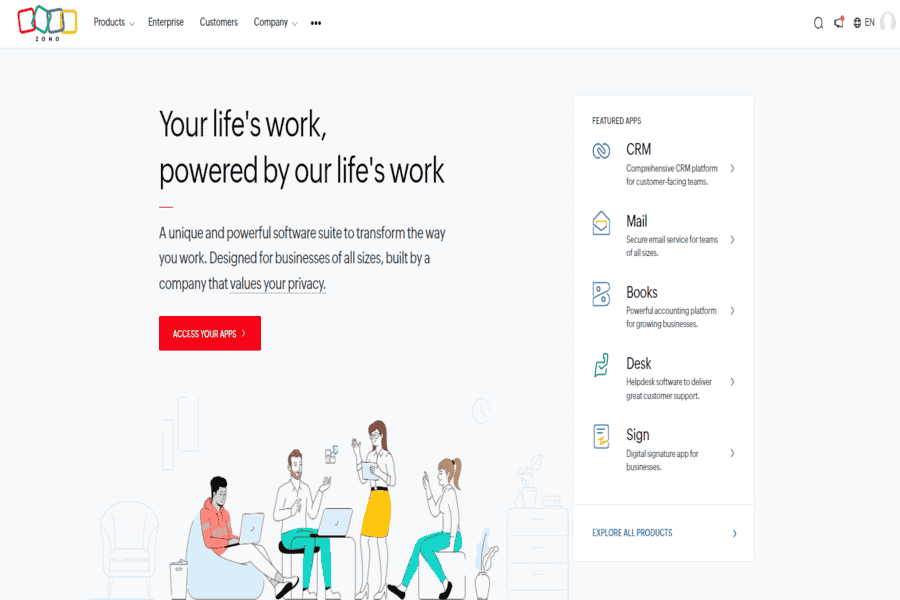
Zoho Analytics is a cost-effective BI tool with AI-driven data visualization capabilities. It offers charts, graphs, and reporting features suitable for small to medium businesses.
Key Features:
- AI assistant for queries and insights.
- Pre-built connectors for easy data integration.
- Customizable reporting and dashboards.
Pros:
- Affordable pricing plans.
- Easy-to-use interface.
- Strong integration with the Zoho ecosystem.
Cons:
- Limited scalability for enterprise-level operations.
- Fewer advanced visualization options compared to competitors.
Pricing:
- Basic Plan: $24/month.
- Premium Plan: $48/month.
Social Media Links:
- Facebook: facebook.com/ZohoAnalytics
- Instagram: instagram.com/zoho
- LinkedIn: linkedin.com/company/zoho
- Twitter: twitter.com/zohoanalytics
- YouTube: youtube.com/Zoho
Contact Information:
- Email: [email protected]
- Contact Number: +1-888-900-9646
ThoughtSpot
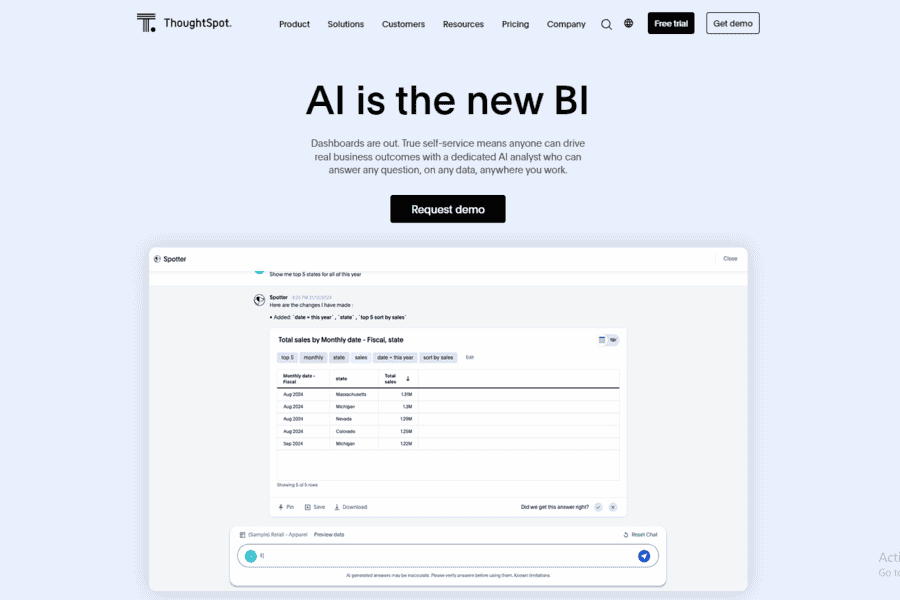
ThoughtSpot leverages AI to enable search-based analytics, allowing users to ask questions and get instant visualizations. It’s ideal for businesses seeking self-service BI solutions.
Key Features:
- Search-driven analytics and reporting.
- AI insights with automated suggestions.
- Integration with multiple data sources.
Pros:
- Intuitive interface for non-technical users.
- AI-driven proactive insights.
- Scalable for large datasets.
Cons:
- High cost for small teams.
- Requires setup time for data integration.
Pricing:
- Custom pricing based on organizational needs.
Social Media Links:
- Facebook: facebook.com/thoughtspot
- Instagram: instagram.com/thoughtspot
- LinkedIn: linkedin.com/company/thoughtspot
- Twitter: twitter.com/thoughtspot
- YouTube: youtube.com/ThoughtSpot
Contact Information:
- Email: [email protected]
- Contact Number: +1-800-508-7008
TIBCO Spotfire
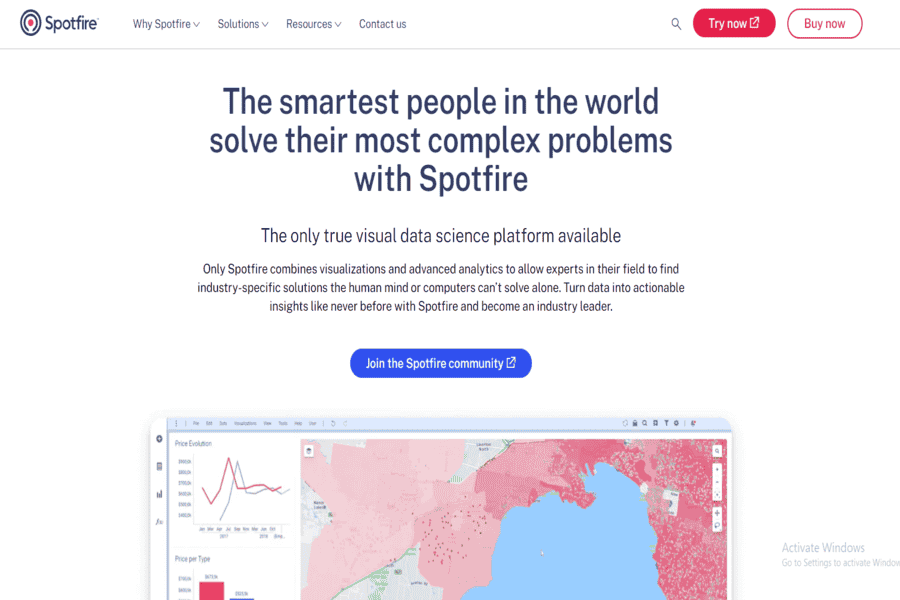
TIBCO Spotfire combines AI with advanced analytics for real-time data visualization. It offers a powerful platform for predictive and prescriptive analytics.
Key Features:
- AI-driven recommendations and visualizations.
- Built-in data preparation tools.
- Real-time analytics and collaboration.
Pros:
- Strong predictive analytics capabilities.
- Highly customizable dashboards.
- Excellent integration options.
Cons:
- Steeper learning curve.
- Expensive for small businesses.
Pricing:
- Starting at $65/user/month.
Social Media Links:
- Facebook: facebook.com/tibco
- Instagram: instagram.com/tibco
- LinkedIn: linkedin.com/company/tibco-software
- Twitter: twitter.com/TIBCO
- YouTube: youtube.com/TIBCO
Contact Information:
- Email: [email protected]
- Contact Number: +1-800-420-8450
Hex
AI-native notebook and BI platform combining SQL, Python, and visualization in one workspace — replaces Chartio in this list, which Atlassian acquired in 2021 and fully discontinued in March 2022 with no successor product.
Key Features:
- Notebook-style analysis alongside shareable interactive dashboards.
- AI-assisted query and chart generation from natural language.
- Real-time collaboration on the same analysis, similar to a shared document.
Pros:
- Bridges the gap between data-scientist notebooks and business-facing dashboards.
- Strong for teams that need SQL/Python flexibility, not just drag-and-drop charts.
Cons:
- Steeper learning curve for non-technical users than a pure point-and-click tool.
Pricing:
- Free tier available; paid plans start around $36/editor/month.
Altair SmartWorks
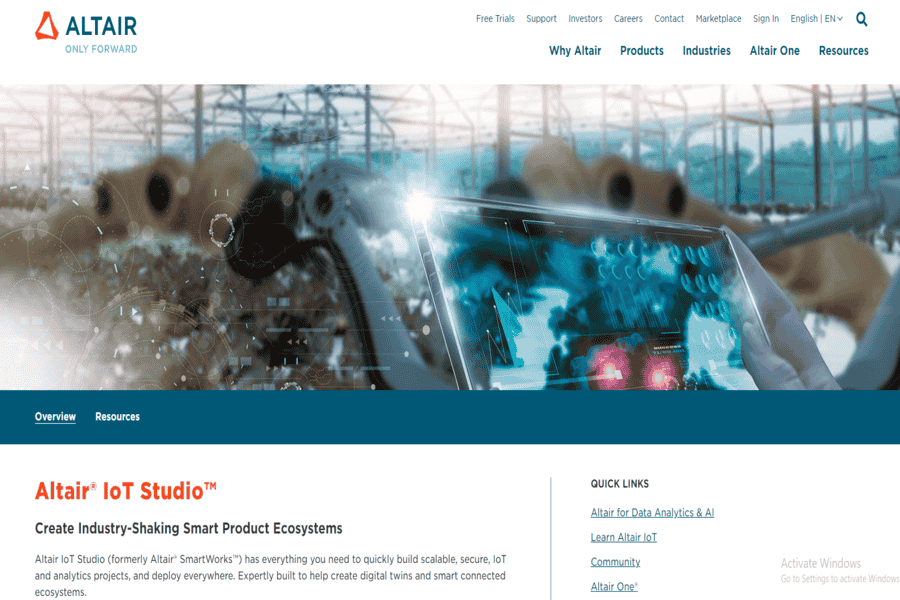
Altair SmartWorks is a platform combining AI, IoT, and data visualization for actionable insights. It’s designed for industries dealing with large and complex datasets.
Key Features:
- AI-powered predictive analytics.
- IoT integration for real-time data.
- Customizable dashboards and reports.
Pros:
- Excellent for IoT and industrial analytics.
- Advanced machine learning capabilities.
- Scalable for enterprise needs.
Cons:
- Requires technical expertise.
- Custom pricing may be expensive for small teams.
Pricing:
- Custom pricing based on business requirements.
Social Media Links:
- Facebook: facebook.com/altairengineering
- Instagram: instagram.com/altairengineering
- LinkedIn: linkedin.com/company/altair
- Twitter: twitter.com/altairengineering
- YouTube: youtube.com/AltairEngineering
Contact Information:
- Email: [email protected]
- Contact Number: +1-248-614-2400
Mode Analytics
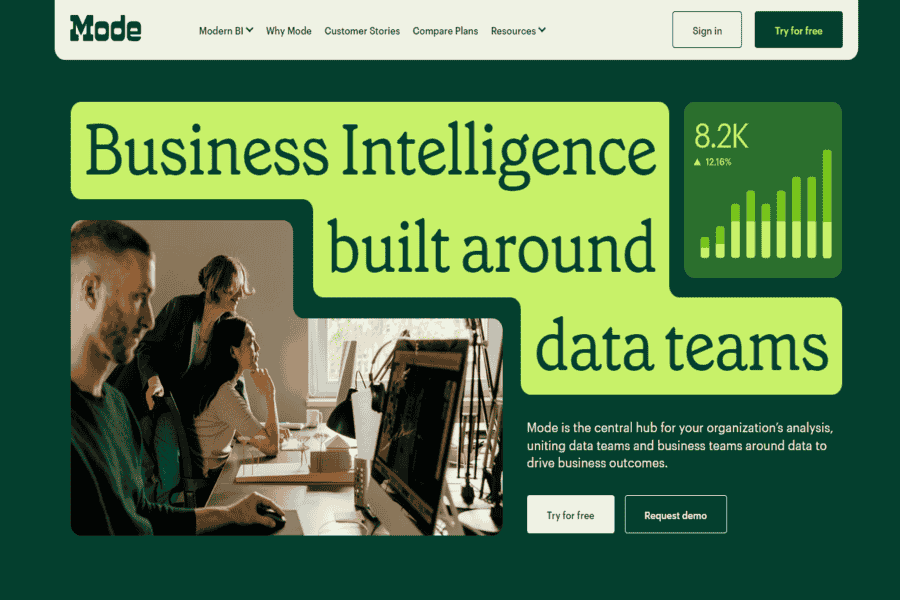
Mode Analytics integrates AI and SQL to deliver advanced data visualization. It’s designed for data scientists and analysts who require detailed insights and visual reports. ThoughtSpot (also in this list) acquired Mode for $200M in 2023; it continues to operate as its own product under ThoughtSpot rather than being folded away.
Key Features:
- AI-driven data exploration.
- Collaboration tools for teams.
- Advanced SQL-based query functionality.
Pros:
- Ideal for technical users and data scientists.
- Highly customizable reports.
- Fast data processing.
Cons:
- It needs to be more user-friendly for beginners.
- Pricing may be high for small businesses.
Pricing:
- Starting at $29/user/month.
Social Media Links:
- Facebook: facebook.com/modeanalytics
- Instagram: instagram.com/modeanalytics
- LinkedIn: linkedin.com/company/mode-analytics
- Twitter: twitter.com/modeanalytics
- YouTube: youtube.com/ModeAnalytics
Contact Information:
- Email: [email protected]
- Contact Number: +1-415-960-1620
DataRobot
DataRobot combines AI and machine learning with data visualization tools to provide predictive analytics. It’s tailored for businesses seeking automated insights and decision-making tools.
Key Features:
- Automated machine learning (AutoML).
- AI-driven insights and forecasts.
- User-friendly visualizations.
Pros:
- Exceptional for predictive analytics.
- Automated workflows reduce manual effort.
- Scalable for enterprises.
Cons:
- High learning curve for beginners.
- Expensive for small businesses.
Pricing:
- Custom pricing based on organizational needs.
Social Media Links:
- Facebook: facebook.com/DataRobot
- Instagram: instagram.com/datarobot
- LinkedIn: linkedin.com/company/datarobot
- Twitter: twitter.com/DataRobot
- YouTube: youtube.com/DataRobot
Contact Information:
- Email: [email protected]
- Contact Number: +1-617-765-4500
KNIME Analytics Platform
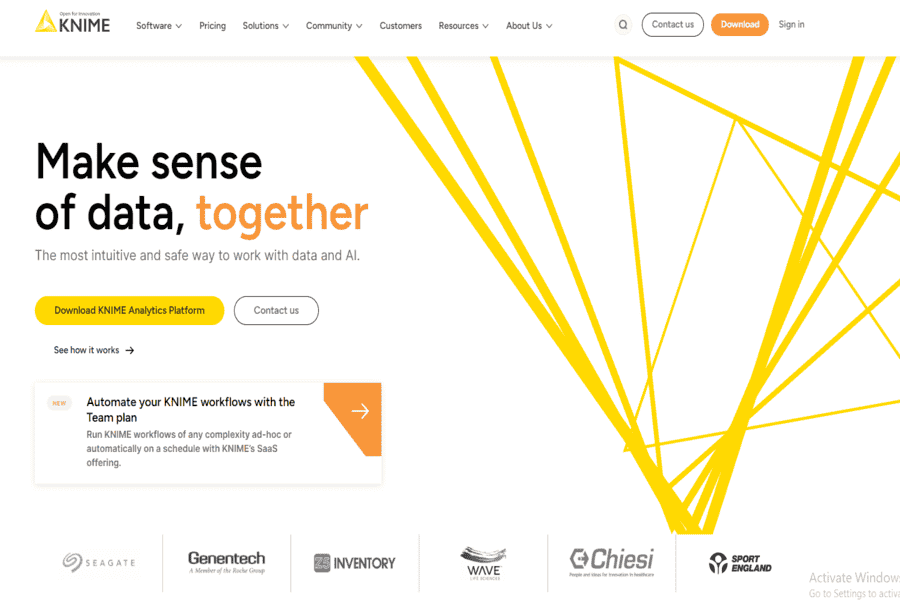
KNIME Analytics Platform is an open-source data visualization tool with AI capabilities. It provides advanced analytics and machine learning integration for businesses of all sizes.
Key Features:
- AI-powered predictive models.
- Wide range of visualization and analytics nodes.
- Support for open-source and enterprise tools.
Pros:
- Free and open-source for basic features.
- Flexible and customizable workflows.
- Excellent for data science applications.
Cons:
- Requires technical expertise.
- Limited customer support for free users.
Pricing:
- Free for open-source version.
- Custom pricing for enterprise solutions.
Social Media Links:
- Facebook: facebook.com/KNIME
- Instagram: instagram.com/knime
- LinkedIn: linkedin.com/company/knime
- Twitter: twitter.com/knime
- YouTube: youtube.com/KNIME
Contact Information:
- Email: [email protected]
- Contact Number: +41-61-511-9274
Challenges of AI in Data Visualization
These tools have real limits. Output is only as good as the data feeding it, and cleaning/preparing messy source data is still where most of the actual project time goes, no matter how good the visualization layer is. More sophisticated models can be genuinely hard to interpret — if an analyst can’t explain why the AI generated a particular insight, that’s a real trust problem, not a minor UX gap. Being transparent about what an AI-generated visualization does and doesn’t account for matters, since a confident-looking chart can mislead just as easily as a poorly labeled one. And getting real value out of these platforms — not just prettier default charts — takes genuine data science and engineering skill on the team using them.
Where This Is Headed
Real-time visualization — dashboards that update continuously rather than on a scheduled refresh — is moving from a premium feature to a baseline expectation. Natural language is changing how people interact with these tools too: asking a plain-language question and getting a chart back, rather than building one manually. Explainable AI is getting real investment, driven by the same interpretability concerns above. AR/VR-based data exploration remains more experimental than mainstream, but is worth watching in specialized industries (engineering, architecture) where spatial data genuinely benefits from it. And ethical AI practices — disclosure, bias-awareness in how data gets represented — are becoming a real evaluation criterion for enterprise buyers, not just marketing language.
Conclusion
The 15 tools above split into a few groups: enterprise BI platforms (Tableau, Power BI, Looker, Qlik Sense, IBM Cognos, TIBCO Spotfire, Sisense, Domo) built for large-scale organizational reporting; AI-native and code-first tools (ThoughtSpot, Mode Analytics, Hex, DataRobot, KNIME) aimed at deeper analysis rather than just dashboards; and accessible, mid-market options (Zoho Analytics, Altair SmartWorks) for teams that don’t need full enterprise scale. Match the tool to your team’s technical depth and the scale of reporting you actually need — the enterprise platforms carry real licensing and implementation cost that isn’t worth it for a small team’s needs.